Header Bidding Analytics
Full reporting
These days a huge number of Publishers implement Header Bidding ad sales on their sites. That's obvious, header bidding wrapper scripts are only scripts and a flow of bids on a browser or server backend. In the majority of cases, wrappers have no UI or reporting interface. Publishers are obliged to trust SSPs reporting while calculating revenues and have no chance for deep bidding process analysis and knowing what is happening in auctions and what were opportunities that lost.
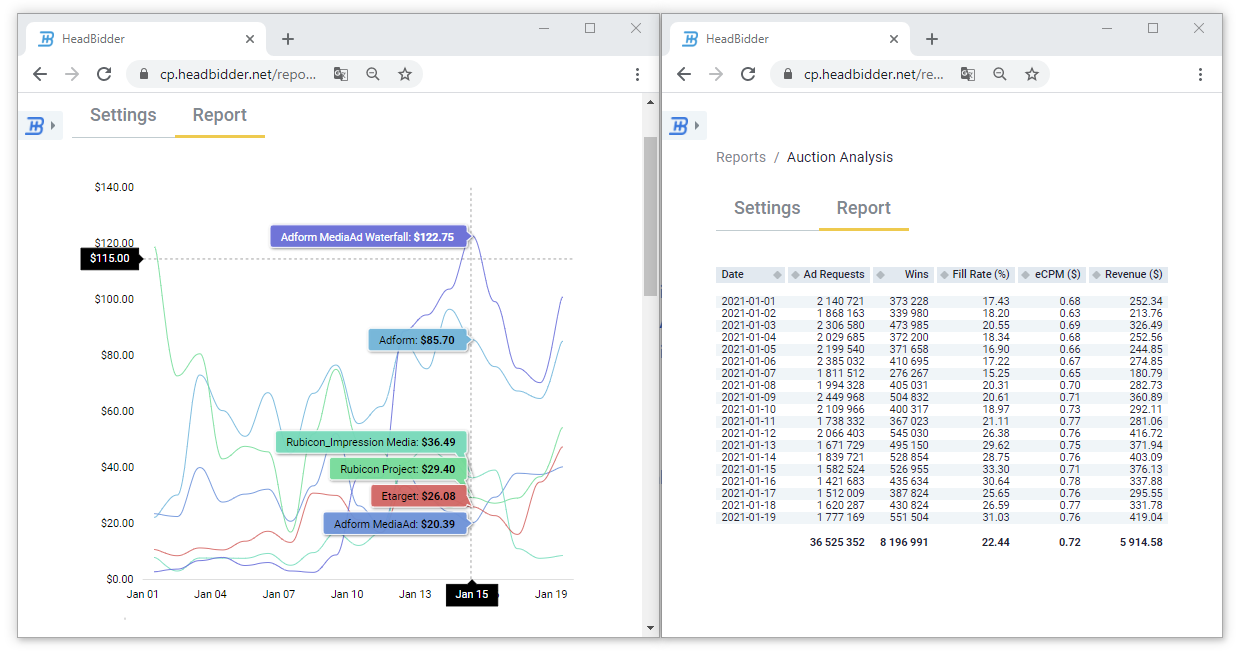
Header Bidding Analytics tool provided by HeadBidder.net collects data on the client's side, directly from the prebid.js auction in the user's browser. It records ALL the bid requests sent and ALL the bids received, not only the winning ones. A user obtains aggregate bidding activity info. This allows to estimate missed auction opportunities, and not only see the auction results. This information is related to both, banner and instream-video ad sales.
Reporting metrics, dimensions and values
What answer header bidding analytics answers to:
- How much revenue do you make each day from each bidder?
- How does the bid response time of each demand partner compare to others?
- Who is the underperforming demand partner in terms of bid rate and win rate?
- Which one of your demand partners is slowing-down bidding, who brings the worst time-out?
- What is the best time-out value to get the highest website revenue?
- What discrepancies you have and where they come from?
